CONCORDIA UNIVERSITY
|
|
Springer Journal Signal, Image and Video Processing: November 2017
Contact: amer att ece.concordia.ca
Abstract
Software
To get the MATLAB code Download here
Dataset
To get the Dataset Download here
Supplementary results
Other NR-IQA properties: Dynamic Range and Stability
- KROCC results using PSNR and MSSIM as the ground-truth.
Numerical Results (from the paper)
1. The following experiments show QI of real noisy and denoised images using SDQI for sample images. SDQI shows quality improvement as it confirmed subjectively.
| Room | Painting1 | Office | Painting2 | Tears | Church | Turbine | Baby | |
| Noisy | 13.30 | 21.03 | 12.91 | 20.05 | 12.52 | 10.87 | 16.44 | 22.72 |
| Denoised | 15.20 | 27.58 | 15.78 | 26.98 | 14.71 | 13.87 | 18.02 | 26.91 |
2. Average of different metrics for denoised images from TID2013 using SDQI as a denoising parameter selector under different noise types. Ground-truth is PSNR and MSSIM.
| SROCC (PSNR) |
KROCC (PSNR) |
SROCC (MSSIM) |
KROCC (MSSIM) |
PSNR | MSSIM | |
|---|---|---|---|---|---|---|
| AWGN | 0.57 | 0.50 | 0.61 | 0.53 | 32.46 | 0.87 |
| Spatially Correlated AWGN |
0.63 | 0.57 | 0.70 | 0.65 | 31.23 | 0.85 |
| Lossy Compressed AWGN |
0.65 | 0.57 | 0.64 | 0.56 | 31.92 | 0.86 |
Visual Results
Each of the following visual comparisons show left the REAL-noisy and right the denoised part of sample images. We expect higher QI in the denoised output. Table 1 above confirms that.
Church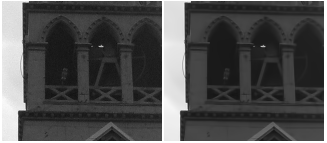 | Office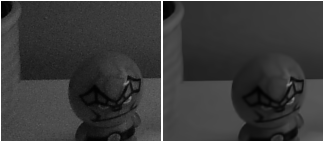 |
Painting 1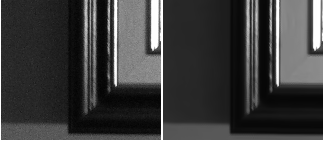 | Painting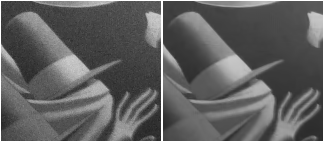 |
Room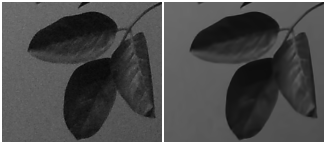 | Tears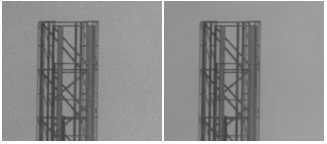 |
Turbine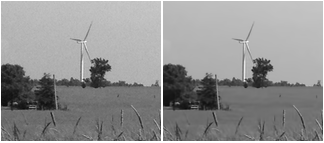 | Baby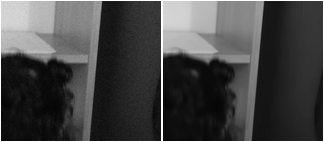 |
General Distortions
3. SROCC and KROCC values for SDQI using the actual distortions in the TID2013 database and using the MOS as the ground-truth.
| AWGN | Gaussian Blur |
JPEG Compression |
JPEG2000 Compression |
Spatially Correlated Noise |
Impulse Noise |
Compression + Noise |
Denoise | |
|---|---|---|---|---|---|---|---|---|
| SROCC (MOS) |
0.86 | 0.90 | 0.53 | 0.76 | 0.69 | 0.86 | 0.84 | 0.76 |
| KROCC (MOS) |
0.83 | 0.85 | 0.46 | 0.73 | 0.67 | 0.84 | 0.81 | 0.70 |