Dietrich Fahrenholtz and Volker Haarslev
University of Hamburg, Computer Science Department,
Vogt-Kölln-Straße 30, D-22527 Hamburg, Germany
e-mail: {fahrenho, haarslev}@kogs.informatik.uni-hamburg.de
This poster describes a visualization tool that uses polar coordinates to create a circular shaped layout of large call trees of Strand programs. Due to the enormous amount of processes which are generated during execution of parallel Strand programs, conventional techniques to display call trees are overcharged. Out of this motives the tool `Polaranimation' was developed and implemented. One of its prominent features is the ability to display the complete call tree without loosing any vital information. Additionally, it provides debugging facilities and supports the performance tuning of parallel programs. A number of Strand programs have been written and a performance evaluation and comparison guided by `Polaranimation' was conducted.
Software Visualization, Strand, Parallel Logic Programming, Debugging.
Parallel programming in general is difficult in two senses: The first one is to create logically correct programs and the second one is to gain the maximum performance out of parallel programs. Software visualization seems to be a highly effective approach to aid comprehension of the complex concurrent events and transitions that occur in parallel programs. So, if we want to support programmers to better understand what is happening during the execution of their programs, we have to process and visualize the event data gathered from program executions. Unfortunately, the sheer amount of data can be so high that conventional tools are not appropriate in all cases to display the whole structure properly. This problem becomes even more critical if one tries to lay out a hierarchy with much more than 1000 nodes with these browsers (e.g. daVinci [2]).
Polaranimation is a tool which visualizes post-mortem traces of an and-parallel logic programming language called Strand (see [1] for details). The tool enables users to browse and inspect large call trees (# of nodes >> 1000).
Polaranimation has options to replay the execution by incrementally adding new nodes to the call tree in creation order, display suspended processes, and to show message passing events that occur between processes.
Software Visualisation has received a great deal of attention in recent years. One reason is that pictorial information and pictures make data and algorithms easier to understand for programmers. There exist a great variety of visualisation tools to aid programmers in developing parallel programs (A good overview can be found in [4], for instance). Every author approaches this field of research with different views and priorities. Those in [2, 5, 6], for example, have a special concentration on hierarchically structured information.
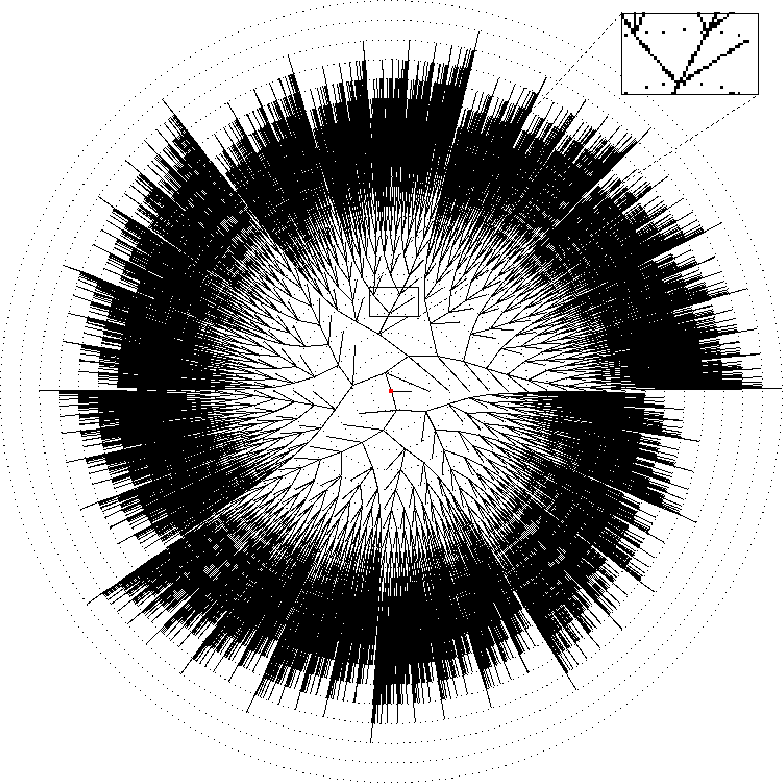
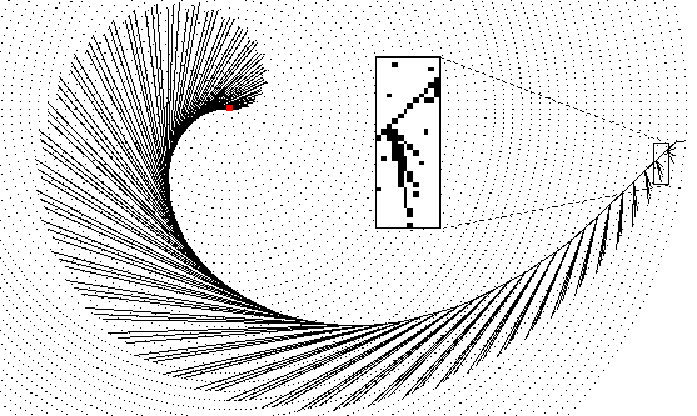
The main goal of this project has been the invention of a new view to visualize large hierarchical call trees of Strand programs and to supply programmers with basic visual debugging capabilities. The graphical rendering of a call tree in polar coordinates was first introduced by Tick [6]. It has two main advantages: First of all, it utilizes the available space far better than techniques which use a ``christmas tree layout'' and in the second place it exploits the human visual processing system to analyse and spot important information. Unless the whole tree fits into a single window, a compression algorithm is run on the tree to shrink the image. The algorithm warrants that no vital information is lost. If users still want to see that information, they can zoom in and out the tree. Node information is also supplied if users click on the respective node.
Usually, trees grow from their root to their leaves and the number of subnodes is generally increased by a factor of 2 or more. The exponential growth of leaves becomes a problem if only a fixed width of display space is available. To circumvent this problem we have introduced a polar coordinate system which guarantees linear display space increase from lower to higher levels.
Trace statements are inserted in the original Strand program in order to give an account of the chronological order and the process actions. Nodes representing Strand processes are extracted from a trace file under inspection.
Nodes in trees are connected with the caller-callee relation. A node gets a weight according to the weight of its children plus the height of the node. This assures that nodes with a greater number of children get a larger allocation sector than nodes with fewer children.
If the height of trees becomes too large, a level compression is performed. That means, some levels are stripped off the tree but the shape is preserved. If an allocation sector is less than a pixel, all children which fall into that sector and their decendants are removed from the tree. This is called width compression. It is possible to replay the execution; that is, nodes are attached in chronological order to the tree in ``forward'' mode and removed in ``backward'' mode. As an auxiliary debugging facility, programmers can monitor the message passing events from one process to another. They also have the option to see suspended processes and statistics of the trace. For a comprehensive presentation of these features see [3].
Among many other Strand test programs, two simple but illustrative algorithms computing fibonacci numbers were implemented. Figures 3 and 1 show the algorithm and the corresponding call tree. Figures 4 and 2 show the improved versions. The naive algorithm spawns 5 subprocesses to compute one fibonacci number (lines 4 - 8). This means that 5 branches should emanate from every ancestor fib process. Within the small frame of figure 3 only 3 of 5 of these branches can be seen because the 3 assignment statements get such a small allocation sector that they virtually overlap. The improved algorithm uses a list to record all fibonacci numbers. In line 1 two previously computed fibonacci numbers are assigned to variables No1 and No2 whereas Rest is the list's tail. Rest expands to a list with a new fibonacci number plus a tail not considered any further. Figure 4 shows a small frame where an ancestor process spawns 4 subprocesses (see lines 2 - 5). The very right branch to the last level is the base case (line 6). Although parallelism for the naive algorithm is excellent, it requires generating 65671 processes whereas the improved algorithm only generates 196 processes and even computes 50 fibonacci numbers.
The response time of the tool is quite fast. The processing and redisplay of traces is about 430 trace statements per sec. on a Sun SPARCstation 10. This is significantly faster than visualization tools which use complex layout algorithms to get optimal results within fixed display space.
The approach to visualize a call tree in a polar coordinate system has a great potential. Programmers can see very large call trees on one window and they are able to zoom in and out. The tool's algorithms are fast and easy to implement. Since call trees are hierachies, other hierarchies can be visualized, too. Polaranimation is thus not restricted to Strand programs. All things considered, Polaranimation helps programmers to improve their understanding of what is happening during the execution and aids in performance tuning of their programs.
1    fib(Num,Count) :- Count =< 1 |
2            Num := Count.
3    fib(Num,Count) :- Count > 1 |
4            Num is Num1 + Num2,
5            Count1 is Count - 1,
6            Count2 is Count - 2,
7            fib(Num1,Count1),
8            fib(Num2,Count2).
9
10    % Invocation: fib(Res,20)
Fig. 1. Naive fibonacci algorithm
1    fib([No1,No2|Rest],Count) :- Count > 0 |
2            No3 is No1 + No2,
3            Count1 is Count - 1,
4            Rest := [No3|_],
5            fib([No2|Rest], Count1).
6    fib([_,_|Rest],0) :- Rest := [].
7
8    % Invocation: fib([0,1|Res],50)
Fig. 2. Improved fibonacci algorithm
| [1] | Foster, I., and S. Taylor: Strand. New Concepts in Parallel Programming, Prentice Hall, 1990 |
| [2] | Froehlich, M. and M. Werner: The Graph Visualization System daVinci - A User Interface for Applications, Technical Report No. 5/94, Univ. of Bremen, Dept. of Comp. Sci., 1994 |
| [3] | Fahrenholtz, D.: Visualisierungen von StrandTM Prozessen, Diploma Thesis in German, Univ. of Hamburg, Dept. of Comp. Sci., to appear, 1995 |
| [4] | Kraemer, Eileen, John T. Stasko: The Visualization of Parallel Systems: An Overview, Journal of Par. and Dist. Comp., 18(2), pp. 105-117, 1993 |
| [5] | Lamping, J., R. Rao, and P. Pirolli: A Focus+Context Technique Based on Hyperbolic Geometry for Visualizing Large Hierarchies, Proc. of ACM CHI'95, to appear, 1995 |
| [6] | Tick, E. and D.-Y. Park: Kaleidoscope Visualisations of Fine-Grain Parallel Programs, Technical Report CIS-TR-91-18, Univ. of Oregon, Dept. of Computer and Information Science, 1991 |

