|
4 Phase Two: Application to an Artificial Problem
Phase Two of this
project presents the application of the Bluenome Model of Development to a
non-trivial evolutionary task. The task chosen is new, consisting of a
situation inspired by biology. The goal of the experiments in Phase Two is
the evolution of multi-cellular agents, capable of surviving as long as
possible in an artificial world.
The
artificial agents are presented; An agent is a collection of cells, each
with a defined behavior. These cells are laid out (connected) in a matrix
of Grid Cells, and provided with an amount of food initially, a cell using
one unit of food per discrete time step. Also in this environment are laid
out patches of food; To survive longer, an agent must detect this food,
move over top of it, absorb it, and distribute it to the remainder of
cells in its body. All cells are capable of local interactions only - a
cell communicates or passes food only in its local neighbourhood.
The task
presented was chosen for several reasons: (1) It is a highly complicated
task, one for which a human designer would experience difficulty; (2) It
is a task which easily lends itself to varying phenotypic complexities;
(3) Its solution may potentially involve mechanisms found in nature; (4)
It combines the need for an internal agent logic embedded as a physical
component in the agent.
Additionally, a second model of
development is presented, one in which the relation between genotype and
phenotype is bijective. The purpose of this inclusion is to evaluate the
claims made regarding the developmental process in agent design - to
attempt to demonstrate that a developmental model may outperform a
bijective model. This is not a claim that the Bluenome method is the best
available, however, rather that it is simply a viable option for
high-dimensional design problems.
4.1 Worlds
A world is an infinite
two-dimensional matrix of Grid Cells. Each world contains one agent at the
centre, and a distribution of food. There are no collisions -
instead, an agent will pass directly over top of food in the world,
possibly absorbing it. Food is parceled in food pieces, each occupying one
Grid Cell, having a value of 2*(numTel+1)2 food units.
Food is distributed differently, depending on world type. Distances
between the agent's starting point and the food batches varies between low
and high phenotypic complexity runs, the former being placed closer.
Type 0
worlds
contain eight batches of food, laid out in a circle surrounding the agent.
Type 1 worlds consist of a line of four patches of food, these
patches being placed in successively longer distances in one direction. Type 2 worlds consist of four patches of food placed in random
locations, slightly farther away than the range of vision of the closest
possible eye cell. Type 3 worlds consist of 40 small batches of
food distributed randomly in a donut shape surrounding the agent.
4.2 Agents
An agent is a collection of one
or more cells, assumed to be connected. Each cell occupies one grid
location. Agents behave as the sum of the
behaviours of their
cells. So long as one cell is declared "active", an agent is declared
"active" - otherwise "inactive".
Cells may be viewed as
independent agents of their own right - each maintains a food supply, and
executes a particular program based on input and internal variables. Cells
may communicate and pass food between adjacent cells (four or eight-neighbourhoods).
A cell is "active"
(coloured
)
if its food supply is greater than zero, otherwise "inactive" (black). An
inactive cell will continue to occupy physical space, but will no longer
be capable of processing input or output or absorbing food.
All
cells belong to one of the following classes: Eyes (Green), Nerves
(Orange), Feet (Blue), Transports (Red) and Structure Cells (Gray).
Eyes: Eye cells can sense their
external environment, and return a boolean value on the basis of the existence
of food. However, the presence of other cells within its field of vision will
block its ability to sense - hence, an eye cell must be located on the
periphery of a agent in order to be capable of functioning.
Nerves: Nerves are cells which
accept information from neighbouring eye or nerve cells, and output the
(possibly transformed) sum to neighbouring nerve or foot cells. Nerves may have
up to four inputs, four outputs, or any combination thereof, determined by
connections to eye cells. Nerves output the sum (identity nerves), the
negative of the sum (inverse nerves), or the sum plus a random value
from {-1, 0, 1} (random nerves).
Feet: Foot cells accept input
from all neighbouring nerve cells. Following all other computation, an agent
sums the motion of each foot, and moves accordingly (weighted by total size of
agent). Forward foot cells move forward (backward for negative
input), and rotation foot cells rotate counter-clockwise (clockwise).
Transports:
Transport cells manage the collection and distribution of food. At each
time step, a transport cell will: collect food from its environment, and
pass food to all neighbours in the eight-neighbourhood.
4.3 An Agent in the World
An agent is initialized in the
centre of a world, each cell containing 200 units of food, with
time defined as zero.
The agent next executes the following process at every time step,
considering only active cells:
1.
Replace any cells with no food with inactive cells
(black, in the GUI)
2.
Each transport cell collects any food from the
environment
3.
Each transport cell passes food to its neighbours
4.
Compute the depth of each nerve cell, where a nerve
has depth 1 if it is connected to an eye cell, 2 if it is connected to a
nerve connected to an eye, etc. Random nerve cells which are not connected
to an eye cell are also labeled depth one.
5.
Eye cells are activated, returning 1 if food is
within field of vision.
6.
All nerve cells of depth one collect input and
compute output, continue for each successive depth
7.
Each foot cell collects input, adding output to the
total
8.
The agent moves accordingly.
Fig. 4.3.1
is an illustration of perhaps the
simplest agents capable of finding and absorbing food. As a curiosity, consider
Fig. 4.3.2, an agent in a similar situation; This agent's actions would
cancel each other out, leading to immobility.
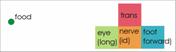
Fig. 4.3.1
One of the simplest
agents capable of finding and absorbing food

Fig. 4.3.2
An immobile agent
4.4 Development
Two methods of
development are used: the Bluenome method, as introduced in section 2, and
a Bijective method. The bijective method of agent development is a simple
model, in which there exists a one-to-one correspondence between elements
in the genome, and cells present in the agent. The genome for an agent
consists of an
array of integer values, all
between 0 and 9, inclusively. A bijective agent is developed by laying
out the values of those integers one by one, in a spiral pattern,
eventually forming a diamond of area 2*(numTel+1)2 -
hence, an agent with numTel = 6 will have at most a genotypic and
phenotypic complexity of 98; With numTel = 20, a complexity of
882. The genome values are mapped to cell types, where the 0 value is
mapped to the empty cell. The spiral layout begins with the central
point, and proceeds biased downwards and clock-wise.
4.5
Experimental Setup
The base fitness
of an agent in the world is a measure of its size and length of life,
relative to a world w.
|
fitnessbase(a)
W = Σt numCells(a,t)
|
(1)
|
where numCells(a,t) is
the number of living cells in agent a at time t. Note:
since the amount of food in a world is finite, so is fitnessbase.
To help the
Bluenome model overcome the development of trivial agents, we introduce
a bonus to fitness (for both Bluenome and bijective versions). We define
numClasses Î
[4]
to be the number of those classes for which at least one cell exists in
the fully developed agent.
|
fitnessbonus(a)
= numClasses (a)2*20*(numTel+1)
2
|
(2)
|
Finally, our fitness function
is:
|
fitness(a)W = fitnessbase(a)
W + fitnessbonus
(a)
|
(3)
|
In any particular generation,
an agent a will be subjected to two worlds, w1
and w2., chosen at random (our fitness is stochastic):
|
fitness(a) =
fitness(a) W1 + fitness(a)
W2
|
(4)
|
Table 4.5.1 shows the
minimum-bonus fitness (the fitness of an agent which has maximized its
size and fitnessbonus, but which does not collect any
food) and the maximum fitness of agents relative to the parameter numTel.
Evaluation of the Bluenome system
involves a series of experiments, differentiated by the model for growth
(Bluenome versus Bijective, or bn versus bj), and also by value of numTel.
The experiments consisted of one run of each the Bluenome and Bijective systems
for numTel
ò
in
{6, 8, 10, 12} (low phenotypic complexity). Additionally, there were
three runs for each of the Bluenome and Bijective systems with numTel = 20;
(high phenotypic complexity).
5 Data and Analysis
Data for the low
phenotypic complexity runs (numTel
ò
in
{6, 8, 10, 12}) showed little variance between values of numTel;
Hence, only data for the numTel = 6 runs are shown.
As mentioned previously, a
problem with the Bluenome model is the failure of many genomes to
develop anything non-trivial; Indeed, single cell or single colour
organisms appear to be the norm. However, with the addition of the
fitness bonus introduced in Section 4.5, selection quickly removes this
difficulty. Figure 5.1 shows the population of the first few
generations, partitioned into classes on the bases of the number of
colours present in the phenotype.
Fig. 5.1
The population of a Bluenome numTel=20 run, partitioned by number of
colours (nC) which appear in the phenotype.
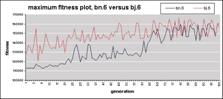
In the low phenotypic
complexity runs, the bijective runs outperform substantially, as
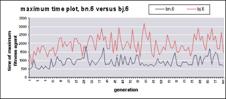
illustrated in Fig. 5.2. Also, Figure 5.3 shows a comparison between
maximum time for the numTel = 6 runs - the bijective version
typically outperforms the Bluenome version. Contrary to initial
expectations, this is not a boon, but instead a drawback. The primary
failing of the bijective method is its inability to generate an adequate
transport system for distributing food throughout its body. The
successes of the bijective model typically involve small groups of cells
hoarding food, while no new food is found following time step 200.
|
|
|
|
Fig.
5.2.
Maximum fitness of the Bluenome versus the Bijective run for numTel
= 6. The Bijective run clearly outperforms initially; While the
Bluenome run catches up in later generations, it never reaches the
same levels.
|
Fig.
5.3.
Maximum
time (of the most fit agent) plot for the Bluenome versus the
Bijective run, with numTel = 6. The Bluenome version clearly shows a
lower maximum time consistently.
|
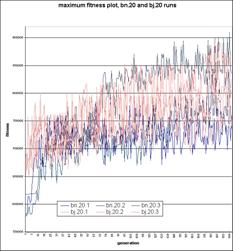
Fig. 5.4 show the fitness
plots of the numTel = 20 runs. In these runs, a different trend
is seen; Here, the bijective runs all follow a similar course. They
begin with some visible evolution, until they reach maximum fitness
values in a range of about 720 000 to 850 000 (in all cases prior to
generation 100), where they appear to oscillate between values randomly;
It appears that the complexity of the space involved exceeds the GAs
ability to improve. The lowest of the Bluenome runs shows a similar
course to the bijective runs, with some initial evolution and a
seemingly random cycling of values following. However, the other two
Bluenome plots show a continuous evolution proceeding up to generation
200, potentially continuing beyond this point. Additionally, the highest
run quickly shows consistent maximum fitness values which exceed the
maximum found in any of the bijective runs. Figure 5.5 clearly shows the
continuation of the fitness / time trend - the Bluenome models clearly
distribute food between body components more evenly.
|
|

|
|
Fig. 5.4.
Maximum Fitness plots for three of
each of the Bluenome and Bijective runs, with numTel = 20. The
Bijective runs (light lines) outperform initially, but two of
the Bluenome runs (dark lines) catch up by generation 150.
One run can be seen overtaking the Bijective runs, beginning with
generation 70.
|
Fig. 5.5.
Time / Fitness plots (of the most fit
agent) of three Bluenome runs (dark lines) versus the
Bijective runs (light lines). The Bluenome runs are clearly
higher consistently.
|
|
|
|
|
|
|
|
|
|
|
|
|
|
|
|
|

|

|
Fig.
5.6
- An
agent from a run with
numTel
= 20,
generation 180 (left), re-grown having changes the value of
numTel
to 8 (below).
|
|
|
|
|
|
|
|
It has been noted that
Phase Two presents an artificial problem for which human designers would
experience difficulty; Three (of many) identified agent strategies are
presented in the following figures: Fig. 5.7 illustrates a member of the
blind-back-and-forth strategy: This strategy may be viewed as a
local optimum which often dominates early generations. These agents
typically do not include eye or rotation foot cells, relying instead
solely on random nerves and forward cells, moving back and forth on the
x-axis. This strategy works marginally well for worlds of type 0 and 3,
but rarely for other worlds; Fig. 5.8 illustrates a member of the rotate-then-forward strategy, perhaps the most successful strategy
found - The agent rotates randomly, until it sees food, then moves
forward; Fig. 5.9 illustrates a member of the position-then-rotate
strategy, another local optimum: initially the agent moves forward,
until it is at the same distance as the first batch of food. Then, it
begins to trace a constant circular path - this strategy works poorly on
most worlds, except on type zero, where it may be a global optimum.
Page 1,
Page 2, Page 3
|