|
2.2
Prey
In
a divergence from the methodology in the original CellNet [5], the second
population in the CellNet Co-Ev system consist of Prey; Prey are primarily
images, drawn from the CEDAR database of hand-written digits. In addition to the
image, Prey disguise themselves via a set of camouflage functions, controlled
genetically.
A Prey consists of a simple
genome - an image index and a series of bits:
|
Image Index I
|
Bit b1
|
Bit b2
|
.
|
Bit bk
|
The Image Index points to a
particular image in the database. The Bits are Boolean parameters, indicating
whether a particular camouflage function is to be applied or not.
Prey
exist to be passed to Hunters for classification - prior to this, however, all
camoflauge functions specified by the series of bits in a Preys genome are
applied - hence, a Hunter views a transformed version of the original Image
specified by the Image Index.
Camouflage functions used by the CellNet Co-Ev system consist of {Salt-Pepper,
Scaling, Translation, Rotation} (Made explicit in Appendix A), the effects of
each shown in Fig. 2.2.1. These particular functions were chosen as they were
topologically invariant (save Salt-Pepper, unlikely to have an effect).
Parameters for the functions were chosen such that simultaneous application of
all to an image would still yield a human-readable image.
Crossover for a Prey is single-point and fixed-length, occurring within the
series of bits. Mutation flips a single bit in the series.
2.3
Agent Fitness and Competitive Co-evolution
The relationship between Hunters and Prey in the
CellNet Co-Ev system is defined through their interaction in the Genetic
Algorithm. Both populations are initially spawned randomly. For each
generation, each agent is evaluated against the entirety of the opposing
population. Explicitly:
Let
h be a member of the Hunter population H, p a member of the Prey population P.
For each generation, each Hunter h attempts to classify each Prey p - let
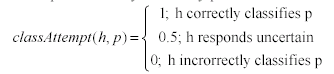
|
(1)
|
Then the
accuracytrain of a hunter h is

|
(2)
|
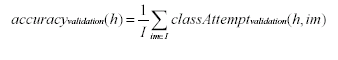
Note
that accuracytrain differs from the traditional definition of the
accuracy of a classifier. Later, when discussing the Validation Accuracy of a
Hunter, we shall use a different measure on an independent validation set of
(non-camouflaged) images, im in I.

|
(3)
|
Leading to the familiar measure of accuracy, which we
shall call accuracyvalidation.
|
(4)
|
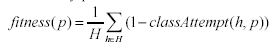
Fitness of a hunter is defined as

|
(5)
|
where alpha is a system parameter designed to limit Hunter complexity, and
complexity(h) is the number of cells in Hunter h.
In
contrast, the fitness of a Prey p is defined as
|
(6)
|
which is proportional to the inverse of fitness for Hunters.
As is evident from the relation between Hunters and Prey, the two populations
exist in a state of Competitive Co-Evolution. The purpose of the addition of
Camouflage functions to the database of images is two-fold:
-
It artificially increases the size of the
database of images provided, by creating subtle changes in existing images.
Hence, the system has a broader palette of training data.
-
The dynamics of the populations creates a more
difficult problem for the Hunter population - not only do Hunters have to deal
with an artificially large number of agents, it is precisely the
transformation which they most often fail to recognize which will comprise the
bulk of the next population of Prey. Hence, a Hunter population's weak points
are emphasized.
4
Data and Analysis
The CellNet system was tested using the CEDAR database of handwritten numbers.
Unlike previous experiments, only one pattern recognition task was attempted,
although it is expected that scale-up to other handwritten languages, such as
Indian or Chinese digits, is still possible. The system was configured to
generate five binary hunters for each digit - these are labelled h.x.y,
where x is the digit number, and y an index from 0 to 4. Each
hunter was trained using a base set of 250 training images, and tested via an
independent set of 150 validation images.
All hunters were
developed using identical system parameters, although training and validation
images for each run were chosen randomly from a pool of 1000 images. The hunters
were placed in a genetic algorithm, using fitness-proportional selection and
elitism (for definitions, refer to [Mitchell]). Parameters were a rate of
crossover of 0.8, a rate of mutation of 0.02, a rate of merger of 0.02, and a
rate of elitism of 0.1. The complexity penalty used in fitness was set to
0.0002. Prey were evaluated similarly - fitness-proportional selection, elitism
of 0.1, crossover of 0.8 and mutation of 0.02.
Each run was executed for a maximum of 250 generations, outputting data
regarding validation accuracy each 10 generations. A typical run may be seen in
the evolution of the h.0 hunters, as illustrated in Fig. 3.1. Training and
validation accuracies are very close, although validation accuracy tends to
achieve slightly higher levels - this behaviour is typical of all digits. This
is in contrast to previous experiments involving CellNet on hand-written
characters, where overfitting of approximately 2-3% was reported consistently [Kharma].
It is also noted that in initial generations of the runs, overfitting is common,
as it can clearly be seen that the training plots are more accurate than the
validation plots; This initial bonus, however, disappears by generation 60,
where the validation plots overtake. However, also in contrast to previous
experiments, complexity is vastly increased - in the case of the zero digit,
mean complexity jumps from approximately 35 cells to approximately 65 cells,
while the complexity of the most accurate agent jumps from 40 cells to
seemilngly random oscillations in the range of 50 cells to 350 cells. Fig. 3.2
shows the complexities of the most accurate agents and the mean for the h.0
runs.
Fig. 3.1
- Maximum
training (light lines) and validation (dark lines) accuracies for
the h.0 hunters
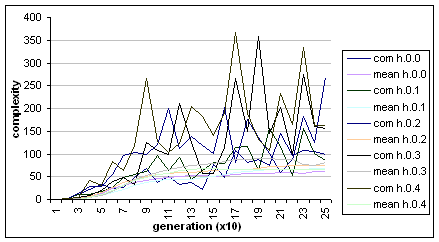
Fig. 3.2
Complexity of most fit agents (dark lines),
and mean complexity (light lines) for the h.0 runs.
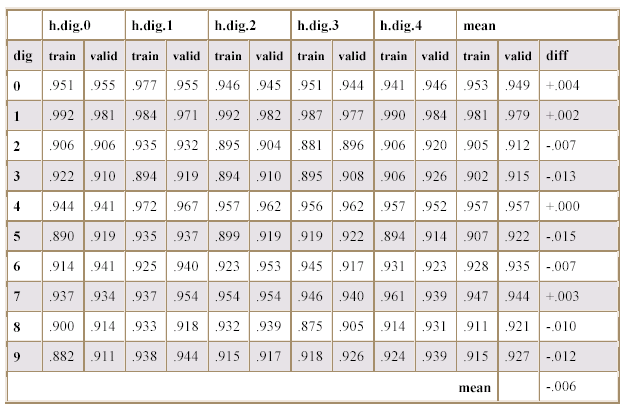
Table 3.1 shows
the maximum training and validation accuracies for each binary hunter. The final
columns compute the means for the validation and training accuracies for each
class of hunter, and compare the difference. It is shown that the mean
difference between training and validation data is -0.006, implying slight underfitting of the classifiers to the training data.
Table 3.1
Maximum Training and Validation
Accuracies for the Binary Classifiers
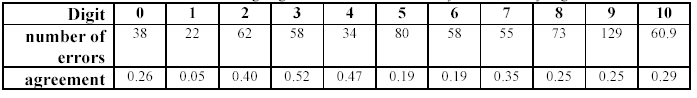
Finally, a series of experiments was undertaken regarding the classifications of
the evolved binary classifiers; The scope of these experiments was the
determination of the relative independence of the errors made by the classifiers
when classifying images. Hence, our goal was a measure of the variance found
between the errors of the hunters for each particular digit.
Each hunter evaluated a set of 300 previously unseen images - a note was made
for each error. Each classifier for any particular digit then had an associated
error list of images, These lists were contrasted, computing the total number of
errors (for all 5 hunters) and the percentage of the list shared by two or more
hunters. These results are shown in Table 4.2; It is evident that there is much
variance between the errors made by the various hunters.
Table 3.2
- Percentage agreement in errors made by classifiers by digit
5
Conclusions
Relative to the original CellNet experiments, our augmented system performs
admirably. The creation of binary classifiers is accomplished for each digit,
showing little variance between results; This is contrasted against the original
CellNet project's use of 30 runs to find a good classifier.
Additionally, the problem of over-fitting has been eliminated through the
inclusion of competitive co-evolution. The inclusion of a genome for patterns
and camouflage functions for diversification has resulted in a more difficult
problem for the classifiers, increasing overall performance.
Finally, it has been demonstrated that although the reliability of the system's
ability to generate classifiers has been improved, the produced classifiers'
error sets are largely independent; This matter is crucial for the creation of
multi-classifiers (combinations of the binary classifiers to form a single
multiple-class recognizer), a step which a practitioner may wish to take. The
independence of the error rates of the classifiers implies that several hunters
for each class may be used in a bagging or bootstrapping technique, methods
which are expected to improve the accuracy of the overall multi-classifier.
These results represent a significant step forward for the goal of an
autonomous pattern recognizer: competitive co-evolution and camouflage is
expected to aid in the problem of over-fitting and reliability without expert
tuning, and also in the generation of a larger and more diverse data set.
References
1.
Brumby, S.P., Theiler, J., Perkins,
S.J., Harvey, N.R., Szymanski, J.J., Bloch J.J., Mitchell, M. Investigation of
Image Feature Extraction by a Genetic Algorithm. In: Proc. SPIE 3812 (1999)
24-31.
2.
Fung, G., Liu, J., & Lau, R.
Feature Selection in Automatic Signature Verification Based on Genetic
Algorithms, ICONIP'96, (1996) pp. 811-815
3. Goldberg, D. E., Korb, B.
and Deb, K., Messy genetic algorithms:
Motivation, analysis, and first results. In Complex Syst., vol. 3, no.
5, pp. 493-530, (1989).
4.
Guo, Z., & Uhrig, R. Using
Genetic Algorithms to Select Inputs for Neural Networks, Proceedings of
COGANN'92. (1992) pp. 223-234
5.
Kharma, N., Kowaliw, T., Clement, E., Jensen, C., Youssef, A., Yao, J.
Project CellNet: Evolving an Autonomous Pattern Recognizer, Int. Journal of
Pattern Recognition and Artificial Intelligence (In publication).
http://www.ece.concordia.ca/~kharma/ResearchWeb/CellNet/cn.pdf
6.
Kudo, M., & Sklansky, J. A
Comparative Evaluation of Medium- and Large-Scale Features Selectors for Pattern
Recognition in Kybernetika, V.34, No. 4, (1998) pp. 429-434.
7.
Mitchell, M. An Introduction
to Genetic Algorithms, MIT Press (1998)
8.
Moser, A. A Distributed
Vertical Genetic Algorithm for Feature Selection, ICDAR '99. pp1-9 (late
submissions' supplement) (1999).
9.
Rizki, M., Zmuda, M.,
Tamburino, L.,
Evolving pattern
recognition systems,
IEEE Transactions on Evolutionary Computation, volume 6, issue 6 , (2002) pp.
594-609
10.
Shi, D., Shu, W., & Liu, H.
Feature Selection for Handwritten Chinese Character Recognition Based on Genetic
Algorithms, IEEE Int. Conference on Systems, Man, and Cybernetics, V.5, (1998)
pp. 4201-6.
11.
Siedlicki, W., & Sklansky, J.
On Automatic Feature Selection, International Journal of Pattern Recognition,
2:197-220 (1998).
12.
Stentiford, F. W. M.
Automatic Feature Design for Optical Character Recognition Using an Evolutionary
Search Procedure, IEEE Trans. on Pattern Analysis and Machine Intelligence. Vol.
PAMI-7, No. 3, (1985) pp. 349- 355.
13.
Vafaie, H., & De Jong, K.,
Robust Feature Selection Algorithms, Proceedings of the IEEE International
Conference on Tools with Artificial Intelligence. (1993) pp. 356-363.
14.
Yeung, D., Cheng, Y., Fong, H., & Chung, F., Neocognitron Based Handwriting
Recognition System Performance Tuning Using Genetic Algorithms, IEEE Int.
Conference on Systems, Man, and Cybernetics, V.5, (1998) pp. 4228-4233.
Appendix A:
Camouflage Functions
Translation Left (similarly for Up, Down and Right):
translation =
translationRatio * width;
If (translation > left most
pixel width value)
then translation =left most
pixel width value
Pass over the pixels (j,j)in
the image
If (pixels stays within the
bound after translation)
set pixels(i,j) to
pixels(i,j+translation)
else
set pixel(i,j) =0
Rotation CounterClockwise (similarly for Clockwise):
Create an image with
pixels(x,y) set to 0
Pass over the pixels (i,j) of
the original image
If (pixels (i,j) not equal to
0)
set x =(int)(j*cos(rotationAngel*PI/180)-(height-1)
*sin( rotationAngel*PI/180));
Set y = height-1-(int)(j*sin(rotationAngel*PI/180)
+(height-1-i)*cos(rotationAngel*PI/180));
if (x,y) is within
image bounds
set pixels(x,y)=1
else
set pixels(x,y)=1
Salt and Pepper:
Set pepper ratio to pr = 1.0-
noisePercent/100.0;
Generate random number
between -1.0 and +1.0
random = 2.0*(rand()-RAND_MAX/2.0)/RAND_MAX;
if(pixel not equal to 0)
if (random > pr)
set pixels(i,j) to 1
Scale:
Create temporary image with
pixels(x,y) set to 0
Pass over the pixels (i,j) of
the original image
if( pixels(i,j) not equal to
0)
if(s_factor*i<height)
if(s_factor*j<width)
set
temporary image pixels(s_factor*I,s_factor*j) = 1
Page 1, Page 2
|