Our main concerns have been the emission of pollutants, maintenance, and system efficiency. The fact that energy (electrical and heat) can be obtained from hydrogen-rich gas e.g. hydrocarbons, promising higher energy efficiency and cleaner emissions, makes the fuel cell the more attractive energy producing alternative.
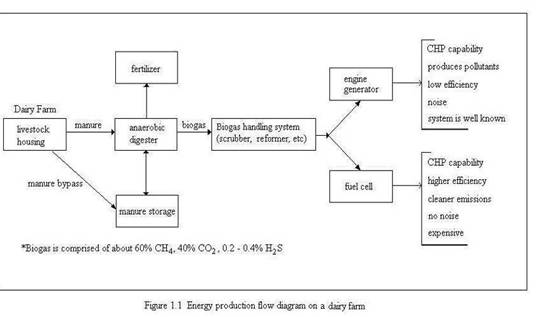
Let us consider a dairy farm that currently uses the anaerobic digester engine-generator system to produce the needed heat and power, and only look at an alternative (i.e. fuel cells) to the engine-generator component of an anaerobic digester system on diary farms, then it is fair to say that the equipment used e.g. plug flow digester, biogas storage equipment, milking equipment, ventilation, lighting, etc. not directly related to the power generator, will remain the same (i.e. the need for these equipment and the electrical demand by these equipment will remain the same). By implementing a fuel cell system in place of the engine-generator, the aspects most likely to be affected are changes in energy efficiency (electrical/heat), the need for maintenance, cleaner emissions and the reduction of greenhouse gases into the atmosphere, and noise reduction which are the expected benefits of a fuel cell system when replacing the engine-generator. To help visualize the energy production process on dairy farms, Figure 1.1 is a flow diagram of an anaerobic digester CHP generating system.
Since the plug-flow digester is the most commonly used digester on dairy farms; ultimately, the type of fuel cell will play an important role in determining CHP capabilities, and the need for auxiliary equipment e.g. reformers. This work will provide general information on the different anaerobic digester and fuel cell types, auxiliary equipment (e.g. reformer) if some other digester fuel cell system is to be considered, as well as grid interconnection requirements, etc. also included is a fuel cell circuit model. However, the anaerobic digester fuel cell system this study is mainly concerned with is the plug-flow digester SOFC (Solid Oxide Fuel Cell) system that could potentially be used to meet the energy and environmental needs of dairy farmers.
-
Energy benefits: CHP – combined heat and power capabilities for high temperature operating fuel cells, renewable energy production i.e. continuous supply of fuel from cow manure, and higher energy efficiency
-
Environmental benefits: Greenhouse gas emissions are reduced and odor control. With a fuel cell, carbon dioxide emissions may be reduced by up to 49%, nitrogen oxide (NOx) emissions by 91%, carbon monoxide by 68%, and volatile organic compounds by 93% [1.2].
-
Noise reduction, improved reliability, and lower system maintenance.
[1.1] A. Ferguson, V. I. Ugursal. A Fuel Cell Model For Building Cogeneration Applications. Canadian Residential Energy End-use Data and Analysis Centre.
[1.2] D. Scott. Advanced power generation from fuel cells -implications for coal. IEA Coal Research, 1993.
[1.3] Y. Zhu, K.Tomsovic. Development of models for analyzing the load-following performance of microturbines and fuel cells. Elsevier, December 2001
[1.4] C. Nelson, J. Lamb. Final Report Summary: Haubenschild Farms Anaerobic Digester. The Minnesota Project, August 2002.
-
Covered Digester – consists of a manure storage lagoon with an impermeable cover. The cover traps gas produced during decomposition of the manure. This design can be used for liquid manure having less than 2% solids and require large lagoon volume and warm climate. Least expensive.
-
Complete Mixer Digester – suitable for all climate conditions. Capable of processing 3% - 10% solids. The manure is processed in a heated tank above or below ground. A mechanical mixer keeps the solids in suspension. This design is expensive to construct and can cost more than the plug-flow digesters to operate and maintain.
-
Plug-flow Digester – handles solid concentrations of 11% - 13%. Raw manure is decomposed as it moves through the tank producing biogas. An impermeable cover is used to trap the released biogas. Heating pipes are used to circulate hot water at 25 – 40 degrees C (77 – 104 degrees F) a temperature range suitable for methane producing bacteria. The hot water can come from recovered waste heat from an engine generator fueled with digester gas or from burning digester gas directly in a boiler.
Table 2.1 Daily manure production
Animal
|
Size |
Manure Production Factor per animal |
Density |
||
Lactating dairy cow |
1000 |
110 |
1.774 |
13.27 |
62 |
Heifer |
750 |
65 |
1.000 |
7.48 |
65 |
Dry cow |
1000 |
82 |
1.323 |
9.89 |
62 |
Swine |
275 |
7.5 |
0.121 |
0.90 |
62 |
Sheep |
100 |
4 |
0.063 |
0.47 |
63 |
Turkey |
20 |
0.9 |
0.014 |
0.11 |
63 |
Horse |
1000 |
50 |
0.794 |
5.94 |
63 |
As can be seen from the above table, a single dairy cow produces about 110 lbs of manure per day having a Total Solids (T.S.) content of about 13%. About 80% of the 13% of Total Solids is Volatile Solids (V.S.) that can potentially produce energy. It is estimated that for each 100 lbs of manure fed to a digester about 4 lbs of manure is converted into biogas and the rest leaves the digester as effluent [2.2]. We can estimate the amount of manure collected per day from dairy cows by:
![]() (2.1)
(2.1)
where: hp = proportion of manure collected (%)
MPF = manure production factor (ft3/day/cow)
From this, we can find the daily amount of biogas produced and thus the heating value. From the heating value, the amount of electrical and heat energy that is available for use, depending on the energy system used (i.e. engine-generator or fuel cell system), can be calculated. With the help of Tables 2.2 and 2.3 these quantities can be obtained through the following:
![]() (2.2)
(2.2)
where: GPF = gas production factor
DGP = daily gas produced ![]()
Table 2.2 Retention time and Gas Production Factor provided by [2.2]
HRT (Retention time) |
Gas Production Factor |
15 days |
30 |
20 days |
34 |
25 days |
37 |
30 days |
39 |
The gas production factors listed in Table 2.2 depend on the retention time of the collected manure. A retention time of 25 days or up to one month is not unusual. To a certain extent, the longer the retention time, the more biogas that can be produced. From the daily gas production, the following can be calculated:
![]() (2.3)
(2.3)
Daily Heat Value (Btu/day) = DGP x heat value of gas (2.4)
![]() (2.5)
(2.5)
![]() (2.6)
(2.6)
where: heat value of gas = the amount of heat energy available in Btu
t = on-line time (%)
hengine = electrical efficiency of engine-generator
hcell = electrical efficiency of fuel cell type
eengine = electrical energy produced from engine-generator (kWh/day)
ecell = electrical energy produced from the fuel cell type (kWh/day)
A list of heating values of gaseous fuels at various temperatures is given in Table 2.3.
Table 2.3 Heating value of different fuels at various temperatures in (Btu/ft3)
Fuel |
25°C |
80°C |
150°C |
200°C |
650°C |
1000°C |
Methane |
915.65 |
900.76 |
895.85 |
895.72 |
894.26 |
890.93 |
Biogas (60% CH4) |
549.39 |
540.46 |
537.51 |
537.43 |
536.55 |
534.56 |
Hydrogen (2H2) |
531.07 |
510.88 |
498.82 |
493.40 |
440.59 |
396.54 |
Table 2.4 Heating value converted into (kWh/ft3) where 1 Btu = 2.9287x10⁻⁴ kWh
Fuel |
25°C |
80°C |
150°C |
200°C |
650°C |
1000°C |
Methane |
0.2682 |
0.2638 |
0.2624 |
0.2623 |
0.2619 |
0.2609 |
Biogas (60% CH4) |
0.1641 |
0.1614 |
0.1606 |
0.1605 |
0.1603 |
0.1597 |
Hydrogen (2H2) |
0.1555 |
0.1496 |
0.1461 |
0.1445 |
0.1290 |
0.1161 |
The heating values listed in Table 2.3 were computed by using a Matlab script (energy_density.m) that found the available free energy at various temperatures for the reactions below. The available free energy was then converted into a heating value.
Hydrogen: 2H2 + O2 " 2H2O (2.7)
Methane: CH4 + 2O2 " 2H2O + CO2 (2.8)
We can use the information above to estimate energy production, e.g. if a single dairy cow were to produce 110 lbs of manure this would in turn produce about 65.6 ft3/day of biogas or 39.4 ft3/day of methane with a retention time of 25 days. At 25°C, using an engine generator with an electrical efficiency of 25%, this would mean an electrical production of about 2.64 kWh per day per cow from biogas having an energy density of 549.39 Btu/ft3. With a constant flow of fuel and oxidant to a fuel cell, it would be ideal for all the energy from the chemical reaction involving hydrogen, Equation (2.7), to be available for use. Unfortunately, this has yet to be obtained because of certain factors that affect the performance of the fuel cell. However, we can estimate the electrical production from a fuel cell by using the electrical efficiency of the cell type used when fed with a constant flow of hydrogen (from reformed biogas) and oxidant. With that being said, the following Matlab script (electrical_production.m) was created to do the following:
-
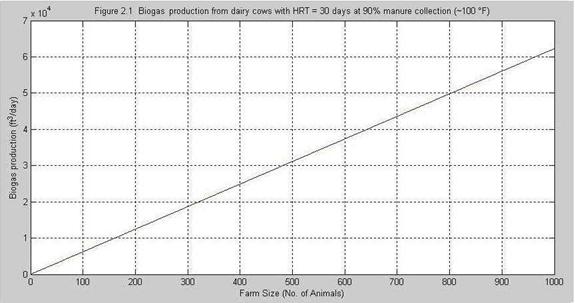
Computes the daily biogas production from dairy cows dependent on the farm size and generates a plot. Assumes a 30 day retention time and a 90% manure collection efficiency. Figure 2.1.
-
Generates a plot of daily electrical production from an engine-generator (
 ) using the daily biogas produced. Assumes a 20% electrical efficiency, and 90% on-line time. Figure 2.2.
 -
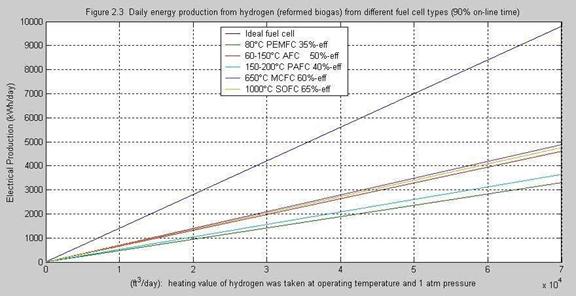
Generates a plot to estimate the daily energy production from different fuel cell types (
 ) and hydrogen gas. The energy production shown in the plot is dependent on the operating temperature, and electrical efficiency of the fuel cell type as noted in the figure. Figure 2.3.
 -
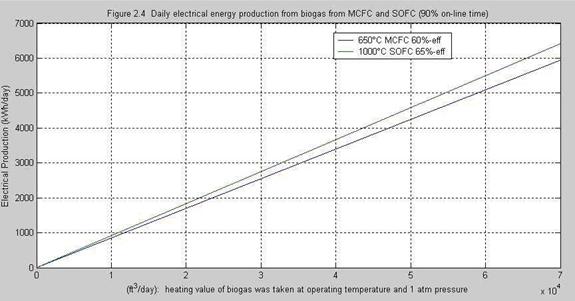
Generates a plot to estimate the daily energy production using MCFC and SOFC from biogas. Figure 2.4.
-
Generates a plot to estimate the daily electrical energy production using MCFC and SOFC from methane (60% of biogas). Figure 2.5
Conventional power generation converts the chemical energy of the fuel (e.g. natural gas) into thermal energy by combustion. This thermal energy is transferred to a working fluid (e.g. water) that will convert the thermal energy to mechanical energy with the help of special engines (turbines). Finally, a generator converts the mechanical energy to electrical energy. This whole process is linked to and limited by the so-called Carnot efficiency. Table 2.5 compares typical fuel-to-power efficiencies of various types of prime movers. These efficiency figures do not account for increases due to the use of cogenerated heat.
Table 2.5 Typical fuel-to-power efficiency values provided by [2.1] |
||
|
|
|
Power Generator |
|
Electrical Efficiency |
Spark ignition engine |
|
18-25% |
Compression ignition |
|
30-35% above 1 MW |
Gas turbine |
|
18-40% above 10 MW |
Microturbine |
|
25-35% below 1 MW |
Steam boiler and turbine |
|
6-35% above 20 MW |
Fuel Cell |
|
40-60% depending on the type used |


One of the primary reasons for considering the use of the fuel cell is the capability of high energy conversion efficiency. There are four aspects of efficiency that must be considered when determining the efficiency of a fuel cell:
1. Voltage efficiency
2. Current efficiency
3. Free energy efficiency and
4. Comparative thermal efficiency
1. If a hydrogen-oxygen fuel cell were to give a potential of 1.23 volts at 25°C when producing current, then all the free energy of the reaction would be completely converted to electrical energy and the cell would be running at a voltage efficiency of 100%. However, in practice, most hydrogen-oxygen fuel cells operating at 25°C run at potentials in the range of 0.6-0.8V and if efficiency is defined by:
![]()
Such cells are running at about 50-65% efficiency. The operating voltage is simply measured during the operation of a cell. The lower operating voltage is the result of activation, concentration, and impedance losses.
2. Current efficiency is based on an assumed stoichiometric equation and is defined in several ways:
![]()
![]()
To illustrate what is meant by current efficiency, consider the following balanced reaction:
Anode: 2H2 D 4H+ + 4e-
Cathode: O2 + 4H+ + 4e- D 2H2O
Overall: 2H2(g) + O2(g) g 2H2O
If the sole product is to be H2O, then all the current produced from the fuel cell consuming hydrogen should be used in forming H2O and the current efficiency is 100%. If e.g. any side products or intermediates are formed, then the end product is formed at a lower efficiency. The following are several reasons that result in a lower current efficiency:
-
Side reactions may occur which yield fewer electrons
-
The reaction proceeds through a series of consecutive reactions to the final end product, where some loss or build-up of intermediates occurs.
-
Crossover reaction occurs between the fuel and oxidant or the fuel is dissolved in the electrolyte.
-
Impurities in the fuel and/or oxidant stream
Most practical fuel cells however are likely to use air as the oxidant and so having a high current efficiency becomes a secondary need.
3. The free energy efficiency (eG) compared to the voltage efficiency offers a better measure of the chemical energy that is being converted to electrical energy and can be defined as the fraction of the available free energy that is converted to electric power. To calculate free energy efficiency where DG’ = -n’FE’and DG = -nFE it follows that:
![]()
4. The comparative thermal efficiency (eT) makes it possible to make the comparison of fuel cells to heat engines. This is defined as:
![]()
Observe that even when eG = 100%, the comparative thermal efficiency of the fuel cell may still be less than 100%. The following example is used to make a comparison of a fuel cell to heat engine. Consider the reaction:
H2(g) + ½ O2(g) g H2O(l)
For which DG = -56.69 kcal and DH = -68.32 kcal at 298°K, it follows that a fuel cell with a free energy efficiency of 60% is as efficient as a heat engine burning hydrogen at a thermal efficiency of ![]() .
.
However, when electrical energy is required from a particular fuel, then the efficiency of the fuel cell should be compared with the overall efficiency of the heat engine burning the fuel and the generator converting mechanical energy to electricity.
Usable heat should be recovered from high temperature operating fuel cells. About 40% of fuel energy from high temperature operating fuel cells is rejected as waste heat. Recovery of this heat for heating the digester, and space heating and hot water needs on the dairy farm are essential. Properly sized heat exchangers can recover about 7,000 Btus of heat per hour for each kilowatt of generator load [2.2]. For example, 140,000 Btu/hr of heat could be recovered from a cogenerator operating at 20 kilowatts (7000 Btu/hr-kW x 20kW = 140,000 Btu/hr) using a heat exchanger.
Figure 2.6 is a diagram of a fuel cell cogeneration system.
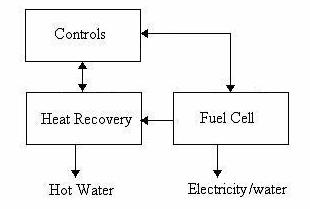
Figure 2.6 Components of a fuel cell cogeneration system
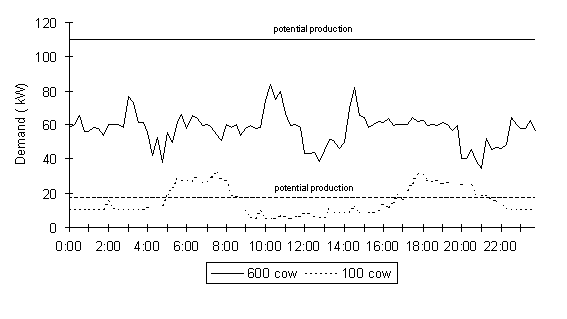
Figure 2.7 Electricity use profile for 100 and 600 cow dairies
Referring back to the example we had earlier, the electrical production from the manure of a cow is approximately 2.64 kWh per day, then 100 cows would have the potential to deliver 11 kW of energy per day ( ![]() ). This is close to what the energy profile shows us as a dotted line at 17kW-18kW. For a farm size of 600 cows, the potential energy that could be delivered was calculated to be 66kW, a 44kW difference from the 110kW that is seen from the profile. Nonetheless, the profile does give us an idea of the daily energy demand needed by dairy farmers for this study.
). This is close to what the energy profile shows us as a dotted line at 17kW-18kW. For a farm size of 600 cows, the potential energy that could be delivered was calculated to be 66kW, a 44kW difference from the 110kW that is seen from the profile. Nonetheless, the profile does give us an idea of the daily energy demand needed by dairy farmers for this study.
A power generation fuel cell system may incorporate several auxiliary devices required for operation and are listed below:
-
Power conditioning unit – is used to convert DC power output from the fuel cell to AC power output suitable for domestic and farming equipment.
-
Auxiliary burner – is used to provide supplementary heat to the fuel processor for process heating if sufficient thermal energy cannot be recovered from hot process streams.
-
Heat extraction equipment and exchangers – during operation, the fuel cell produces heat that must be extracted to ensure that the stack remains at optimal temperature. Extracted heat can be used for heating and domestic hot water purposes. Heat exchangers will transfer heat from streams requiring cooling to streams requiring heating.
-
Compressors and pumps – some fuel cell types may operate at pressures several times that of the ambient, necessitating compressors and pumps.
-
Reformers – converts hydrocarbons such as methane into a mixture of hydrogen and carbon dioxide gases before fed to a fuel cell
-
Gas flow controller – the controller would automatically adjust the gas flow rate when changes in biogas production occur or when load demand changes.
[2.1] P. Wright. Overview of Anaerobic Digestion Systems for Dairy Farms. Agricultural and Biological Engineering Department, Cornell University .
[2.2] R.K. Koelsh, E.E. Fabian, R.W. Guest, J.K. Campbell. Anaerobic Digesters for Dairy Farms. Agricultural and Biological Engineering Department, Cornell University .
[2.3] W.J. Jewell, P.E. Wright, N.P. Fleszar, G.Green, A. Safinski, A. Zucker. Evaluation of Anaerobic Digestion Options for Groups of Dairy Farms in Upstate New York . Department of Agricultural and Biological Engineering, Cornell University , June 1997.
[2.4] renewable Energy World. Renewable fuel cell power from biogas. http://www.jxj.com/magsandj/rew/2001_06/renewable_fuel_cell.html. Nov-Dec 2001.
[2.5] C. Collar, T. Shultz, N. Peterson, A. Wubishet, G. Higginbotham. Dairy and Livestock Research Report. California Dairy Energy Project.
[2.6] National Fuel Cell Research Center . Fuel Cell Benefits. http://www.nfcrc.uci.edu/fcresources/FCexplained/FC_benefits.htm.
[2.7] K. R. Williams. An Introduction to Fuel Cells. Elsevier Publishing Company, 1966.