Cathode – electrode where negative ions are produced (also can be a catalytic metal or a mixture)
Electrolyte – permits only the appropriate ions to pass (positive or negative, e.g. H+, O2-), this means that depending on the electrolyte used only certain ions will conduct through the material – that is to say, H+ may not always conduct through the electrolyte. NOTE: electrolyte does not react with the ions.
How Fuel Cells Operate - A Three Stage Process
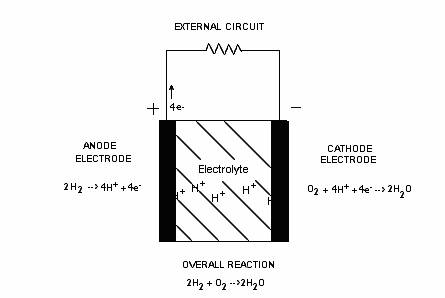
The complete fuel cell process may be divided into three stages; two of these stages involve the chemical reactions at the electrodes and the third, being the ion conduction through the electrolyte. The three stages of a fuel cell are as follows:
(i) At the hydrogen electrode:
The reaction at the anode will involve the release of electrons from the hydrogen fuel that will then be conducted by the electrode to some load.
2H2 g 4H+ + 4e-
To get the process going, hydrogen fuel is fed to the anode where ionization occurs and releases electrons and H+ ions. The hydrogen arrives as a diatomic gas 2H2 where each adsorbed (ads) hydrogen molecule ionizes into four hydrogen protons (H+) and four electrons (e-). The rate of this process can be increased with the help of a catalyst. Because the chemical reaction at this electrode produces positive ions, it can be thought of as the positive electrode or the anode. The negatively charged electrons are then forced to flow from the conductive electrode (anode) to an external load before re-entering the fuel cell into the cathode (i.e. electrons will diffuse naturally from high concentration to low concentration of electrons). However, the hydrogen ions may or may not conduct through the electrolyte since this will depend on the type of electrolyte used, meaning the hydrogen ions may have to temporarily remain at the anode in a receptive state.
(ii) At the oxygen electrode:
Meanwhile, oxygen molecules O2 are diffusing through the oxygen electrode (cathode). According to [3.1], the catalytic surface of the electrode (cathode) facilitates the separation of the adsorbed oxygen molecule (oxygen bonds are broken) into oxygen atoms which are held momentarily into a “receptive” state on the active catalyst. The returning electrons, oxidant, and cathode electrode together causes another reaction to occur where negative ions or products are produced. If these H+ ions are the free moving ions (again, this will depend on the electrolyte used), these positive ions will then be attracted to the negative ions generated at the cathode and will be conducted through the electrolyte and products (i.e. 2H2O) are formed completing the process. If however, H+ ions are not able to travel through the electrolyte, then the reaction at the cathode (negative electrode) must produce the free moving negative ions that will move through the electrolyte to combine with the H+ ions and complete the process.
(iii) Through the electrolyte medium
The electronically-insulated (does not conduct free electrons) electrolyte serves as the physical barrier preventing the fuel and oxidant gas streams from directly mixing allowing only the appropriate ions to move freely across this layer of medium. This requires that one of the reactants must be able to form the ionized specie needed to complete the process and form the primary by-product water.
Summary: The direct conversion of chemical energy into thermal and electrical energy is facilitated by the electrode-electrolyte structure of the fuel cell. Of the two electrodes (anode or cathode), one will produce the appropriate ions (can be thought of as free moving ions that are either positive or negative and can move through the electrolyte) needed to pass through the electrolyte. These ions generated at this electrode are then attracted to the opposite electrode (cathode or anode, respectively) and are conducted through the electrolyte to complete the process.
Background on Fuel Cells Types
There are basically five fuel cell types. Table 3.1 provided by [3.2] summarizes the differences in these fuel cells. The following fuel cells are described in order of operating temperature (ranging from 80 to 1000 degrees C):
1. Proton exchange membrane fuel cells (PEMFC)
2. Alkaline fuel cells (AFC)
3. Phosphoric acid fuel cells (PAFC)
4. Molten carbonate fuel cells (MCFC)
5. Solid oxide fuel cells (SOFC)
1. Proton exchange membrane fuel cells (PEMFC) are also known as solid polymer fuel cells operating at a temperature of 80°C, this results in the capability of bringing the cell to its operating temperature quickly. This type of electrolyte also has the advantage of preventing gas crossover like SOFCs. PEM fuel cells are said to be suited for quickly meeting shifts in power demand for applications that vary in output. However, because the membrane must be hydrated, the fuel cell must operate under conditions where the byproduct water does not evaporate faster than it is produced usually less than 120°C therefore water management issues in the membrane are critical for efficient performance. PEM fuel cells also require very pure hydrogen with minimal or no CO (a poison at low temperature) which puts heavy demands on the fuel processing unit.
2. Alkaline fuel cells (AFC) operate around 120°C to150°C using an aqueous solution of potassium hydroxide (KOH) as the electrolyte. Desirable attributes of the alkaline fuel cell include its high performance compared to other fuel cells and its flexibility to use a wide range of electrocatalysts. However, AFCs are intolerant to CO2 which reacts with the KOH and effectively degrades the cell performance. Even the smallest amount of CO2 in the oxidant would have to be scrubbed when considering the alkaline cell. This constraint requires that pure hydrogen and pure oxygen, not air, be used.
3. Phosphoric acid fuel cells (PAFC) operate at 200°C using liquid concentrated phosphoric acid (H3PO4) as the electrolyte. The relative stability of concentrated phosphoric acid is high compared to other common acids; consequently the PAFC is capable of operating at the high end of the acid temperature range of 200°C. The advantage of using PAFCs is its ability to tolerate some impurities in the fuel stream broadening the choice of fuels they can use, but still requires that hydrocarbon fuels be reformed. Because of the higher operating environment, the rejected heat from the cell is high enough in temperature to be used for heating. Unfortunately, the electrochemical environment within the PAFC at operating temperature is highly corrosive and can best be avoided by special operating procedures.
4. Molten carbonate fuel cells (MCFC) typically use a mixture of alkali carbonates (Li2CO3 and K2CO3) retained in a ceramic matrix, for an electrolyte. The high operating temperature of 650°C is needed to achieve sufficient conductivity in the electrolyte. The advantages of having a high operating temperature include: CHP capability where rejected heat can be recovered and used, flexibility in the electrocatalyst used, and internal reformation where anode poisoning by CO and, to a certain degree, by other reformer gas impurities is no longer an issue. On the other hand, high-temperature corrosion is a major problem for molten carbonate fuel cells and requires the use of expensive materials and protective layers. To date, MCFCs have been operated on hydrogen, carbon monoxide (converted to hydrogen by rapid water-gas shift reaction inside the cell), natural gas, propane, and other hydrocarbons when some pre-reforming is applied.
5. Solid oxide fuel cells (SOFC) have the same advantages (e.g. internal reformation, CHP capability) and disadvantages (e.g. thermal stress, unwanted sintering and corrosion) of high temperature operation as that of the MCFC. The electrolyte is comprised of a hard ceramic material of solid zirconium oxide and ytrria (yttrium-stabilized zirconia - YSZ), allowing operating temperatures to reach 1000°C. SOFCs are capable of generating enough power to be used in high-power applications including industrial and large-scale generating stations.
|
|
PEMFC |
AFC |
PAFC |
MCFC |
SOFC |
|
Electrolyte |
Ion Exchange |
Mobilized or |
Immobilized |
Immobilized |
yttrium-stabilized zirconia |
|
Operating |
80°C |
120°C -150°C |
200°C |
650°C |
800-1000°C |
|
Charge |
H+ |
OH- |
H+ |
CO3-2 |
O-2 |
|
External |
Yes |
Yes |
Yes |
No |
No |
|
Catalyst |
Platinum |
Platinum |
Platinum |
Nickel |
Perovskites |
|
Prime Cell |
Carbon-based |
Carbon-based |
Graphite-based |
Stainless-based |
Ceramic |
|
Product |
Evaporative |
Evaporative |
Evaporative |
Gaseous |
Gaseous |
|
Usable rejected |
Negligible |
Negligible |
Yes |
Yes |
Yes |
|
Gaseous/Liquid Water formation |
Cathode |
Anode |
Cathode |
Anode |
Anode |
|
Fuel |
Pure H2 |
Pure H2 |
Pure H2 |
H2, CO, CH4, other hydrocarbons (tolerates CO2) |
H2, CO, CH4, other hydrocarbons (tolerates CO2) |
|
Electrical Efficiency |
35% |
40-60% |
40-50% |
50-60% |
50-65% |
Table 3.1 Summary of differences in fuel cell types
Process for Each Fuel Cell Type

Figure 3.2 Electrochemical reaction of the different types of fuel cells
PEM: Hydrogen gas, 2H2 is fed to the anode and ionized into 4H+ ion and 4e-. These hydrogen ions are the free moving ions and will conduct through the solid polymer electrolyte. At the cathode, a reaction causes O2 molecules to separate into oxygen atoms which are held in a receptive state. The returning electrons meet the hydrogen ions and combine with the oxygen atoms resulting in the formation of water molecules, 2H2O at the cathode.
PAFC: Same chemical process as the PEM fuel cell. Hydrogen gas, 2H2 is fed to the anode and ionized into 4H+ ion and 4e-. These hydrogen ions are the free moving ions and will conduct through the phosphoric acid electrolyte. At the cathode, a reaction causes O2 molecules, the returning electrons, and hydrogen protons to combine producing water molecules, 2H2O.
AFC: Hydrogen is fed to the anode and ionized into 4H+ ion and 4e-. These hydrogen ions are not free moving ions and will be held in the receptive state at the anode. At the cathode, oxygen O2 and water 2H2O plus returning electrons from the circuit form hydroxide ions 4( OH- ). The free moving hydroxyl ions conduct through the potassium hydroxide (KOH) and combine with the hydrogen ions at the anode forming water.
MCFC: Formation of water will also occur at the anode. The hydrogen ions produced at the anode will not conduct through the electrolyte. The hydrogen gas fed to the anode ionizes into 4H+ ion and 4e-. The cathode process combines oxygen O2 and 2CO2 from the oxidant stream with electrons entering the cathode to produce carbonate ions 2CO3-2 which enter the electrolyte. The free moving carbonate ions conduct through the electrolyte and combine with the hydrogen ions at the anode forming water 2H2O and carbon dioxide 2CO2. The overall reaction shows that no extra carbon dioxide was produced since we put in 2CO2 at the cathode and got out 2CO2 at the anode.
SOFC: Again, we have formation of water at the anode. Hydrogen gas is fed to the anode and ionized into 4H+ ion and 4e-. These hydrogen ions are not free moving ions and will be held in the receptive state at the anode. The cathode process with electrons entering the cathode forms oxygen ions 2O-2. The free moving oxygen ions then conduct through the electrolyte and combine with the hydrogen ions at the anode forming water molecules 2H2O.
Type ions Electrolyte
PEM H+ solid polymer (e.g. Nafion)
PAFC H+ phosphoric acid (H3PO4)
Alkaline OH- potassium hydroxide (KOH) in water
Solid Oxide O-2 yttrium-stabilized zirconia (YSZ)
Molten Carbonate CO3-2 lithium and potassium carbonate mixture (Li2CO3 and K2CO3)
[3.1] D. Booth. Understanding Fuel Cells. Home Power, June-July 1993.
[3.2] Renewable Energy World. Renewable fuel cell power from biogas.
http://www.jxj.com/magsandj/rew/2001_06/renewable_fuel_cell.html - James & James Ltd, Nov-Dec 2001.
[3.3] Smithsonian Institution. A Basic Overview of Fuel Cell Technology. http://fuelcells.si.edu/basics.htm
[3.4] EG&G Services Parsons, Inc. Fuel Cell Handbook 5th Ed. National Energy Technology Laboratory, 2000.
[3.5] K. R. Williams. An Introduction to Fuel Cells. Elsevier Publishing Company, 1966.
Fuel Cell Potential
The open circuit voltage is the maximum operating voltage
(when no current is flowing) of a fuel cell and is determined by the
chemical thermodynamics of the overall cell reaction. The Nernst
equation provides a relationship between the standard potential ( ![]() )
for the cell reaction and the open circuit voltage [4.1]. That is
to say, once the standard potential is known for the desired
temperature (indicated by a subscript T), the open circuit voltage can
be determined at other partial pressures of reactants and products at
that temperature.
)
for the cell reaction and the open circuit voltage [4.1]. That is
to say, once the standard potential is known for the desired
temperature (indicated by a subscript T), the open circuit voltage can
be determined at other partial pressures of reactants and products at
that temperature.
Equation (4.1) is the general form of the Nernst equation for the overall cell reaction and it can be used to determine the open circuit voltage of any fuel cell.
 (4.1)
(4.1)
where:  = open
circuit
voltage
= open
circuit
voltage
 = standard
potential of the reaction
= standard
potential of the reaction
F = Faraday’s number, 96487 C/equiv
R = universal gas constant, 8.314 J/ °K-mol
T = absolute temperature of cell, °K
 = partial
pressures or activity of the species involved
= partial
pressures or activity of the species involved
n = the number of electrons involved (equiv/mol)
x, y = stoichiometric coefficients
The open circuit voltage ET of
the cell by convention is
measured as the potential difference between the potential drop at the
cathode and ![]() the potential drop at the
anode at some
temperature T.
the potential drop at the
anode at some
temperature T.
 (4.2)
(4.2)
For
example, if we use the
Nernst equation, Equation (4.1), for the oxygen and hydrogen reaction
that occurs at the cathode and anode of a PEM fuel cell, respectively,
and then take the difference using Equation (4.2), where we let  ,
we can see that what we get is the Nernst equation for the overall cell
reaction of the PEM fuel cell which is equal to the Nernst equation if
we simply applied the overall cell reaction.
,
we can see that what we get is the Nernst equation for the overall cell
reaction of the PEM fuel cell which is equal to the Nernst equation if
we simply applied the overall cell reaction.
Example 1:
We will leave the subscript T off momentarily for convenience purposes
only, but we will continue to associate the potential to some
temperature T. Using the hydrogen-oxygen fuel cell as an example,
the standard potential of the overall reaction of the cell has been
divided between the two electrodes such that  .
.
Anode: 2H2 D 4H+ + 4e-
Cathode: O2 + 4H+ + 4e- D 2H2O
Overall: 2H2(g) + O2(g) g 2H2O
Using the equilibrium reaction at the anode and Equation (4.2) gives us

This is equivalent to,
 (4.3)
(4.3)
Similarly, using the equilibrium reaction at the cathode and Equation (4.1):

This is equivalent to,
 (4.4)
(4.4)
From Equation (4.2), E is the difference between Equation (4.4) and Equation (4.3):

Simplifying to,

This is equivalent to,
 (4.5)
(4.5)
Alternatively, it can also be shown that the open-circuit voltage E between the electrodes of an ideal fuel cell can be directly obtained from the overall cell reaction using the Nernst equation assuming the number of electrons involved in the reaction is known.
Example 2:
From the overall cell reaction of the hydrogen-oxygen fuel cell and Equation (4.1) gives us:
This simplifies to,
(4.6)
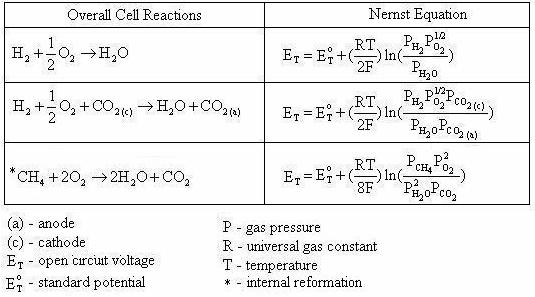
Note that Equation (4.6) is exactly the same as Equation (4.5). By applying the Nernst equation, Equation (4.1), to an overall cell reaction, the open circuit voltage of any fuel cell can be determined. Table 4.1 provides the Nernst equations for various fuel cell reactions [4.2].
Table 4.1 Overall fuel cell reactions and the corresponding Nernst Equations
Standard Potential at Other Temperatures
The following section is the general procedure in which we can find the standard potential of a cell at any temperature. Once the standard potential is computed at the desired temperature it can then be used in the Nernst equation to compute the open circuit voltage at that temperature when the species involved are not at unit activity.
When the ratio of
activity of all
the species are at unity Preactants/Pproducts = 1, then the open
circuit voltage is equal to the standard potential of the cell, that is
 . Equation
(4.7) allows us to calculate the standard
potential of a cell at any temperature T from the free energy change
-DG° for the cell reaction (where equilibrium of the reaction is
indicated with a superscript °).
. Equation
(4.7) allows us to calculate the standard
potential of a cell at any temperature T from the free energy change
-DG° for the cell reaction (where equilibrium of the reaction is
indicated with a superscript °).
 = - nF
Solving for
![]() =
=  (4.7)
(4.7)
where:
= free
energy change for the reaction at
equilibrium at some temperature T
(J/mol)
Using the Matlab script (energy_density.m), when the overall reaction occurs as shown in Equations (2.7) and (2.8), the ideal standard potential for different fuel cell types at their operating temperature can be obtained and are given in Table 4.2.
Table 4.2 Ideal standard potential for different fuel cell types at 1atm pressure
|
|
Ideal H2-O2 Cell |
PEMFC |
AFC |
PAFC |
MCFC |
SOFC |
|
|
direct H2 |
1.230 V |
1.183 V |
1.155 V |
1.143 V |
1.021 V |
0.919 V |
|
|
direct CH4 |
N/A |
N/A |
N/A |
N/A |
1.036 V |
1.032 V |
|
In order to
obtain a voltage that
is usable, several individual fuel cells must be combined together in
series to form what is termed a fuel cell stack. For instance, a
PEM fuel cell stack consisting of 300 individual cells, the open
circuit voltage for this stack would be ![]() .
.
The easiest way to calculate the free energy change of a chemical reaction at some temperature is to use tabulated data for free energy change of a substance at that temperature if available and apply it to Equation (4.8). This will then allow us to calculate the free energy change of a reaction at temperature T and thus the standard potential using Equation (4.7).
 (4.8)
(4.8)
Alternatively,
when free energy
tables are not available at some temperature the free energy change can
be computed from ![]() and
and ![]() from
the
Gibbs-Helmholtz equation:
from
the
Gibbs-Helmholtz equation:
D  =
=  (4.9)
(4.9)
where:
D = free
energy change (cal/mol)
 =
enthalpy change (cal/mol)
=
enthalpy change (cal/mol)
T = temperature (°K)
 =
entropy change (cal/mol-°K)
=
entropy change (cal/mol-°K)
Equation (4.9)
allows us to find
the free energy change as a function of enthalpy and entropy change at
the desired temperature; and again, the standard potential.
Enthalpy (H), and entropy (S), values for a substance may be found in a
tabulated data table to compute the ![]() and
and
![]() for
a chemical reaction at some temperature T:
for
a chemical reaction at some temperature T:

or
 (4.10)

or
 (4.11)
Of course, when
tables for
enthalpy (H) and entropy (S) are not available for a certain
temperature of substance then both and may
be computed from the temperature coefficients of heat capacity, Cp in
the range of [298 °K, 1500 °K]. Empirically it is found
that the heat capacity of a substance has the form:
Cp = a + bT + cT2 (4.12)
Whence
 (4.13)
Where the temperature coefficients a, b, and c have been tabulated. The following equations allow us to relate enthalpy and entropy to heat capacity.
 (4.14)
and
 (4.15)
The following equations then allow us to calculate the enthalpy and entropy of the chemical reaction. The summation of DH298 °K, DS298 °K, and the temperature coefficients below, must take into account the signs and stoichiometric coefficients of Equations (4.10) and (4.11) in order for Equations (4.16) and (4.17) to work as shown in Matlab scripts (energy_density.m) in Appendix C:
 (4.16)
and
 (4.17)
Temperature coefficients a, b, and c for each substance in the reaction are available in Table 4.3 given by [4.3]. Also, values for DH298 °K and DS298 °K are given in Table 4.4 are also given by [4.3].
|
Species |
a |
b x 10-3 |
c x 10-8 |
|
H2 |
6.947 |
-0.200 |
0.481 |
|
O2 |
6.148 |
3.102 |
-0.923 |
|
H2O |
7.256 |
2.298 |
0.283 |
|
CO2 |
6.214 |
10.396 |
-3.545 |
|
CO |
6.420 |
1.665 |
-0.196 |
|
CH4 |
3.381 |
18.044 |
-4.300 |
|
C2H4 |
2.706 |
29.160 |
-9.059 |
|
C2H6 |
2.247 |
38.201 |
-11.049 |
|
C3H8 |
2.410 |
57.195 |
-17.533 |
|
C4H10 |
3.844 |
73.350 |
-22.655 |
|
N2 |
6.524 |
1.250 |
-0.001 |
|
Species |
DH298°K |
DG298°K |
DS298°K |
|
|
|
|
|
|
H2 (gas) |
0.000 |
0.000 |
31.208 |
|
O2 (gas) |
0.000 |
0.000 |
49.004 |
|
H2O (gas) |
-57.800 |
-54.636 |
45.106 |
|
H2O (liquid) |
-68.320 |
-56.690 |
16.720 |
|
CH4 (gas) |
-17.895 |
-12.145 |
44.480 |
|
C (graphite) |
0.000 |
0.000 |
1.359 |
|
C2H6 (gas) |
-20.236 |
7.860 |
54.850 |
|
C3H8 (gas) |
-24.820 |
-5.614 |
64.510 |
|
CH3OH (gas) |
-48.080 |
-38.690 |
56.800 |
|
CH3OH (liquid) |
-57.020 |
-39.730 |
30.300 |
|
Cl2 (gas) |
0.000 |
0.000 |
53.290 |
|
CO (gas) |
-26.417 |
-32.783 |
47.210 |
|
CO2 (gas) |
-94.054 |
-94.265 |
51.070 |
|
Cu (crystals) |
0.000 |
0.000 |
7.960 |
|
CuSO4 (solid) |
-184.000 |
-158.200 |
27.100 |
|
HCl (gas) |
-22.063 |
-22.778 |
44.645 |
|
HCl (liquid) |
-40.023 |
-31.350 |
13.160 |
|
KOH (solid) |
-101.780 |
-90.866 |
18.958 |
|
N2(gas) |
0.000 |
0.000 |
191.500 |
|
NO(gas) |
90.300 |
86.600 |
210.700 |
|
NO2(gas) |
33.200 |
51.000 |
239.900 |
|
Zn (crystals) |
0.000 |
0.000 |
9.950 |
|
ZnSO4 (solid) |
-233.880 |
-208.310 |
29.800 |
Terminal Voltage Due to Losses
The output
voltage  will
be less than the open circuit voltage
will
be less than the open circuit voltage  when
current is drawn from the terminals of a fuel cell by some load due to
the losses described in this section. The terminal voltage is
determined by subtracting these losses (activation, impedance, and
concentration) from the open circuit voltage. Similar to [4.4],
the output voltage at the terminals of a fuel cell stack can be
approximated by:
when
current is drawn from the terminals of a fuel cell by some load due to
the losses described in this section. The terminal voltage is
determined by subtracting these losses (activation, impedance, and
concentration) from the open circuit voltage. Similar to [4.4],
the output voltage at the terminals of a fuel cell stack can be
approximated by:
 (4.18)
where:  =
terminal voltage of the cell
=
terminal voltage of the cell
N = number of cells in the stack
 = open
circuit voltage from Equation (4.2)
= open
circuit voltage from Equation (4.2)
L = voltage losses (activation, impedance, and concentration loss)
The voltage loss can be approximated and expressed by the following:
 (4.19)
where: I = load current
I0 = the exchange current related to activation losses
Ilim = limiting current related to concentration losses
Z = fuel cell impedance
The voltage loss, L primarily consists of the following:
1. Activation losses – loss associated with the rate (or slowness) of the electrochemical reactions taking place at the electrodes as current is drawn and can be expressed as:
 (4.20)
where: a = an empirically determined fraction; it is the electron transfer coefficient of the reaction at the electrode. A value of about 0.5 is usually assumed.
I = load current
I0 = the exchange current is defined as the current flowing equally in each direction at equilibrium
2. Impedance losses – resistive and capacitive losses associated with the flow of electrons and ions in the electrodes and electrolyte.
3. Concentration losses – loss associated with the inability to transport and maintain adequate concentration of reactants to the reaction sites due to clogging when current is drawn. Concentration losses can be expressed as:
 (4.21)
where: Ilim – the limiting current is defined as the maximum current drawn resulting in voltage collapse see Figure 4.2.
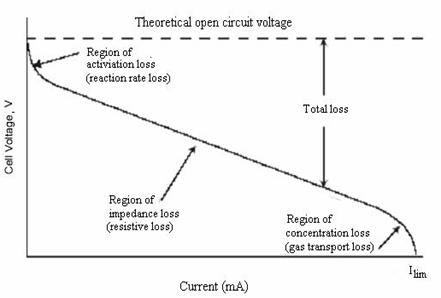
Figure 4.1 Typical fuel cell V-I curve
Figure 4.2, illustrates a typical shape for a measured terminal voltage (V) versus current (I) curve in a fuel cell. It can be seen from the voltage-current curve that an increase in current results in a lower potential that can be shown as being controlled by the regions of activation, impedance, and concentration losses. From Figure 4.2, impedance losses are mainly ohmic or resistive and are a linear function of the current, so the voltage loss displays a linear behavior through this region. It can also be seen that concentration losses become significant under high current loadings.
Before constructing the electric circuit model of a fuel cell, the following assumptions are made:
-
The Nernst equation can be implemented
-
Temperature is uniform and constant
-
Cell impedance accounts for the cell electrical capacitance
-
Gases are ideal
From Equation (4.22), the electric circuit model of a fuel cell can be constructed to get the output voltage VT. The fuel cell circuit model will consist of a main circuit and several sub-circuits as shown in Figures 4.3 and 4.4, respectively.
 (4.22)
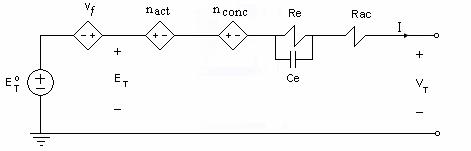
Figure 4.2 Main circuit model of a fuel cell
Activation and
concentration
voltage losses are represented as current-controlled voltage sources
(CCVS). The fuel cell impedance Z is represented by Rac and Re
the resistance of the electrodes and the electrochemical resistance of
the electrolyte, respectively; and Ce which models the dielectric
property of the electrolyte. The Nernst factor  is
represented as a
is
represented as a
voltage-controlled voltage source (VCVS) where the reactant and product partial pressures are modeled using sub-circuits from the ideal gas law.
PV = mRT (4.23)
where: P = pressure
V = volume of gas at the electrode
m = moles of gas
R = universal gas constant
T = operating temperature of the fuel cell, °K
Based on the ideal gas law, the partial pressure of each gas is proportional to the amount of the gas in the cell. Taking the derivate of both sides of Equation (4.23) with respect to time, we get:
 (4.24)
where the rate of
change of gas
partial pressure present in the fuel cell is directly proportional to
the change in moles. Letting  , then for
each
gas present we can write the partial pressure as follows:
, then for
each
gas present we can write the partial pressure as follows:
 (4.25)
Where  is the inlet
flow rate of gas. The amount of gas used
is the inlet
flow rate of gas. The amount of gas used  can be
related
to the output current I drawn from the cell by:
can be
related
to the output current I drawn from the cell by:
 (4.26)
Where: a = stoichiometric coefficient from the chemical equation
We can rewrite Equation (4.24) and observe that this equation is analogous to the current equation through a capacitor:
 (4.27)
where pressure
corresponds to the
voltage across a capacitor, mole flow  corresponds
to
current, and
corresponds
to
current, and  corresponds
to capacitance [4.4].
By relating Equations (4.25) and (4.26) to Equation (4.27), we can
construct the partial pressure sub-circuits for the reactants as shown
below.
corresponds
to capacitance [4.4].
By relating Equations (4.25) and (4.26) to Equation (4.27), we can
construct the partial pressure sub-circuits for the reactants as shown
below.
 (4.28)
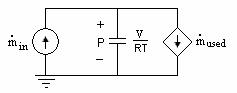
Figure 4.3 Partial pressure sub-circuit for the reactants of a fuel cell
The sub-circuit modeling the partial pressure of water produced is similar with the exception of the current-controlled current source which would flow in the other direction.
Fuel Cell Model using PSpice
-
The circuit in Figure 4.4 models a PEM fuel cell operating at 80 deg. C having a standard potential of 1.18 V using hydrogen and oxygen gas. Other fuel cell types can be modeled by changing the operating temperature and standard potential. For example, by changing the operating temperature to 200 deg. C with a standard potential of 1.14 V, we can model the output voltage of a phosphoric acid fuel cell using hydrogen and oxygen gas.
- The circuit in Figure 4.5 models a solid oxide fuel cell operating at 1000 deg. C having a standard potential of 1.03 V using methane. Again, the sub-circuits model the gases present in the fuel cell.
- Increasing the pressure of the reactants in the fuel cell (by increasing the flow rate of the reactants) will lead to an increase in the open circuit voltage ET as shown in Figure 4.7. However, this increase in voltage is very small, refer to the Nernst factor.
- An increase in current drawn increases voltage losses (impedance, activation and concentration losses increase since they are a function of current) resulting in a lower output voltage see Figure 4.8.
- Build-up of reactants on an electrode impedes the electron transfer process decreasing the output voltage see Figure 4.9. (Similar to increasing the resistance of the electrodes).
- Viscosity (i.e. resists the flow of fluids) increases with increase in concentration of electrolyte. When the concentration of the electrolyte is too high, the flow of ions is impeded increasing the time it takes for the reaction to occur and reduces output voltage see Figure 4.10. (Similar to increasing the time constant of the sub-circuits)
- Viscosity decreases with increase in temperature leading to a faster reaction time due to the increased activity of the reactants see Figure 4.11 (Similar to lowering the time constant of the sub-circuits).
- The use of a catalyst can also speed up the overall reactions increasing the reaction time see Figure 4.12. (Similar to lowering the time constant of the sub-circuit
REFERENCES
[4.1] K. R. Williams. An Introduction to Fuel Cells. Elsevier Publishing Company, 1966.
[4.2] EG&G Services Parsons, Inc. Fuel Cell Handbook 5th Ed. National Energy Technology Laboratory, 2000.
[4.3] M.W. Chase, et al. JANAF Thermochemical Tables 3rd Ed. American Chemical Society and the American Institute of Physics for the National Bureau of Standards, 1985.
[4.4] P. Famouri., R. Gemmen. Electrochemical Circuit Model of a PEM Fuel Cell. IEEE Transactions on Energy Conversion, June 2003.
[4.5] Chemical Thermodynamics. http://www.shodor.org/unchem/advanced/thermo/, The Shodor Education Foundation, Inc, 1998.
[4.6] A. B. Hart, G. J. Womack. Fuel Cells, Theory and Application. Chapman and Hall Ltd., 1967.
[4.7] M. D. Harrington. Residential Fuel Cell System Modeling Study. Department of Electrical Engineering, Clarkson University . Thesis submitted in April 2002.
[4.8] V. M. Reddy. Modeling and Simulation of a 100kW Solid Oxide Fuel Cell and its Dynamic Interaction with a Power System. Department of Electrical Engineering, Indian Institute of Technology. Thesis submitted in May 2003.
[4.9] P.W. Atkins. Physical Chemistry 3rd Ed. W.H. Freeman and Company, 1986.
[4.10] W. S. Angrist. Direct Energy Conversion 3rd Ed. Allyn and Bacon, Inc.
[4.11] L.Y. Chiu, B. M. Diong. An Improved Small-Signal Model of the Dynamic Behavior of PEM Fuel Cells. Department of Electrical and Computer Engineering, University of Texas at El Paso , 2003.
[4.12] W. Pyle, A. Spivak, R. Cortez, J. Healy. Making Electricity with Hydrogen. Home Power, June-July 1993.
[4.13] K. Sedghisigarchi, A. Feliachi. Dynamic and Transient Analysis of Power Distribution Systems with Fuel Cells – Part I: Fuel-Cell Dynamic Model. IEEE Transactions on Energy Conversion, Vol. 19, No. 2, June 2004.
[4.14] K. Sedghisigarchi, A. Feliachi. Dynamic and Transient Analysis of Power Distribution Systems with Fuel Cells – Part II: Control and Stability Enhancement. IEEE Transactions on Energy Conversion, Vol. 19, No. 2, June 2004.